In California Prisons, Hundreds Removed from Solitary Confinement—and Thousands Remain
It has been over three years since the first statewide hunger strike in protest of the California prison systems’ use of solitary confinement. The hunger strike, the first of many to follow, was launched by individuals housed in the state’s Security Housing Units (SHUs). The hunger strikes prompted state Legislative hearings, international scrutiny, and some reforms.
The SHU, first established in 1989 at Pelican Bay State Prison, was designed to house the “worst-of-the-worst” in close, secure, isolated confinement. Keeping individuals in small, windowless cells for 22 1/2 to 24 hours a day eventually proved to be a convenient solution to deal with individuals exhibiting behavioral or mental health problems and real or suspected gang affiliation as well.
The SHU, once limited to Pelican Bay, has been expanded to a total of four male facilities and one female facility. Despite this expansion, California doesn’t have enough room in the SHUs for all the individuals prison officials would like to place in them, necessitating their placement in Administrative Segregation Units (ASUs), which are dispersed throughout each prison.
By 2011, there were thousands of individuals in the SHU, including over 1,100 in the Pelican Bay SHU alone. Of them, approximately half had been in the SHU for over a decade and 78 had been in the SHU for at least 20 years.
In June 2011, individuals in the Pelican Bay SHU coordinated a hunger strike in protest of long-term isolation. The hunger strike lasted three weeks, notably bringing together people of all racial groups. There would be an additional hunger strike that year, followed by a third, 60-day-long hunger strike in July 2013.
Partly in response to the hunger strikes, the California Department of Corrections and Rehabilitation (CDCR) proposed and implemented an array of reforms purportedly aimed at tightening the standards for SHU placement and potentially reducing the number of individuals held in highly restrictive custody.
Beginning in October 2012, the CDCR has changed the criteria used to place individuals in the SHU, created a “Step Down Program” for individuals to transition out of the SHU, and began a process of case-by-case reviews of all individuals held in the SHU and ASU to determined the appropriateness of their placement.
The reviews are ongoing, but the data collected so far is quite revealing.
According to data obtained from CDCR, 725 SHU case reviews have been conducted, with about 69% those cases leading to release to the final step in the Step Down Program and/or a General Population setting. A further 63% of ASU case reviews have led to a return to the general population.
In other words, in most cases, it appears that under slightly stricter standards, CDCR could not justify keeping individuals in highly restrictive, isolating conditions.
With these reviews being conducted for over two years now, and the overall decline of the prison population, one would expect that the number of people in restrictive housing would be on the decline.
Officially, CDCR does not believe it holds individuals in solitary confinement. Thus, a true count of the total number of individuals in such conditions is difficult to determine. The purpose of this research is to use CDCR data to provide a means of determining how many individuals might be in solitary confinement.
The CDCR releases pertinent data through COMPSTAT (COMPuter STATistics or COMParative STATistics). CDCR keeps track of the following data: the number of individuals in single-celled housing, the number of individuals in the SHU and ASU, and the number of individuals in the SHU and ASU in single-celled housing. This data is the closest one can get to determining the number of individuals in solitary confinement.
Total Single Cell Population
Presented first is a comparison of the reported single-cell population per institution in October 2012 and October 2014.

In October 2012, there was a prison population of 124,718. At that time, were 6,281 individuals who were single-celled, or 5.03% of the prison population. In October 2014, there was a prison population of 120,705. There were 5,546 individuals who were single-celled, or 4.59% of the prison population.
In 2012, 4,572 of those single-celled were designated with an S-Suffix, or 72% of the single-celled population. In 2014, 4,975 of those single-celled were designated with an S-Suffix, or 89% of the single-celled population. Individuals designated an S-Suffix are generally placed on single-celled status for longer periods of time.
SHU Population
The SHU is used to house people deemed security threats over the long-term. Given the outcomes of the case-by-case reviews, a reduction in the SHU population has occurred since 2012.

In October 2012, the total SHU population stood at 3,923. In October 2014, the total SHU population was 3,732.
As can be seen in the above chart, there were reductions in the SHU population in all four male institutions, with the exception of the Pelican Bay SHU. In October 2012, there were 1,121 held in the Pelican Bay SHU; two years later the figure was 1,171.
While there has been an increase in the number of individuals in the Pelican Bay SHU, there has also been a decline in the number of individuals in the Pelican Bay SHU on single-cell status. In 2012, 83% of those in the SHU were on single-cell status. In 2014, about 75% of those in the Pelican Bay SHU were on single-cell status.
At the California Institution for Women, there have been slight reductions in use of the SHU. In October 2012, there were 88 women in the SHU, with none on single-cell status. In October 2014, there were 78 women in the SHU, with four on single-cell status.
Among the SHU population system-wide, there have been reductions in the number and percentage of individuals on single-cell status. In 2012, there were 1,849 individuals in the SHU on single-cell status, approximately 47.1% of the SHU population. In 2014, there were 1,721 individuals in the SHU on single-cell status, or about 46.1% of the SHU population.
It is important to note that those removed from single-cell status might well still be locked down 22 to 24 hours a day–but in cells with one or more other people.
ASU Population
Aside from the SHU, the ASU also serves to isolate individuals in the California prison system, though generally for shorter periods of time than the SHU. There is no typical term in the ASU, which can range from hours to years. Unlike the SHU, the ASU is not designed to be long-term housing.
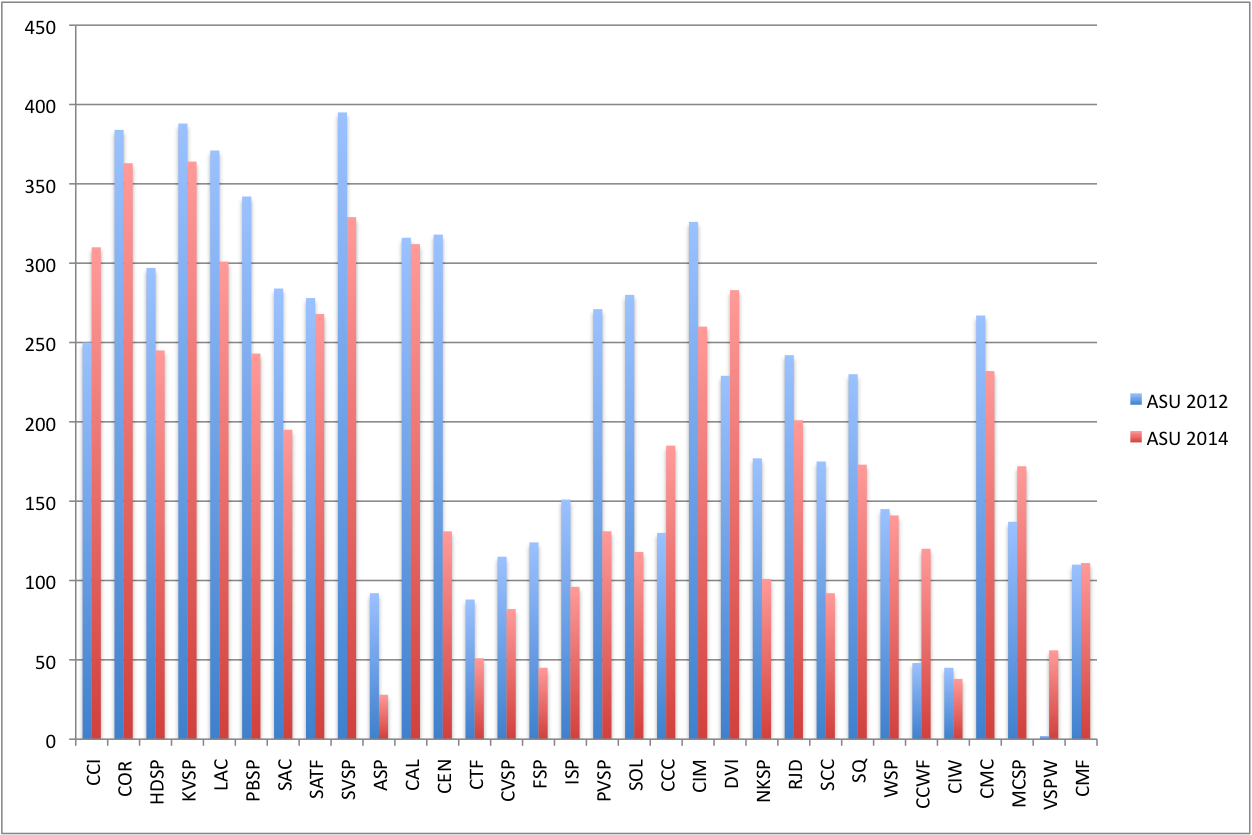
Overall, the total number of individuals in the ASU declined significantly between 2012 and 2014.
In October 2012, there were 7,007 individuals (5.61% of the prison population) in ASUs:
- Of them, there were 1,547 on single-cell status (22%)
- Salinas Valley State Prison had the largest ASU population (395) and the largest population of ASU prisoners on single-cell status (202)
- Valley State Prison reported only having two people in the ASU
- Some prisons reported having no single-celled ASU prisoners: Chuckawalla Valley State Prison, California Correctional Center, San Quentin State Prison, and Valley State Prison for Women
In October 2014, there were 5,777 individuals (4.78% of prison population) in ASUs:
- Of them, there were 1,289 on single-cell status (22.3%)
- Kern Valley State Prison had the largest ASU population (364)
- Salinas Valley State Prison had the largest single-cell ASU population (165)
- Central California Women’s Facility, California Correctional Center and Correctional Training Facility reported only having two people in the ASU on Single-Cell Status
- Some prisons reported having no single-celled ASU prisoners: Avenal State Prison, Chuckwalla Valley State Prison, Sierra Conservation Center, and California Institution for Women
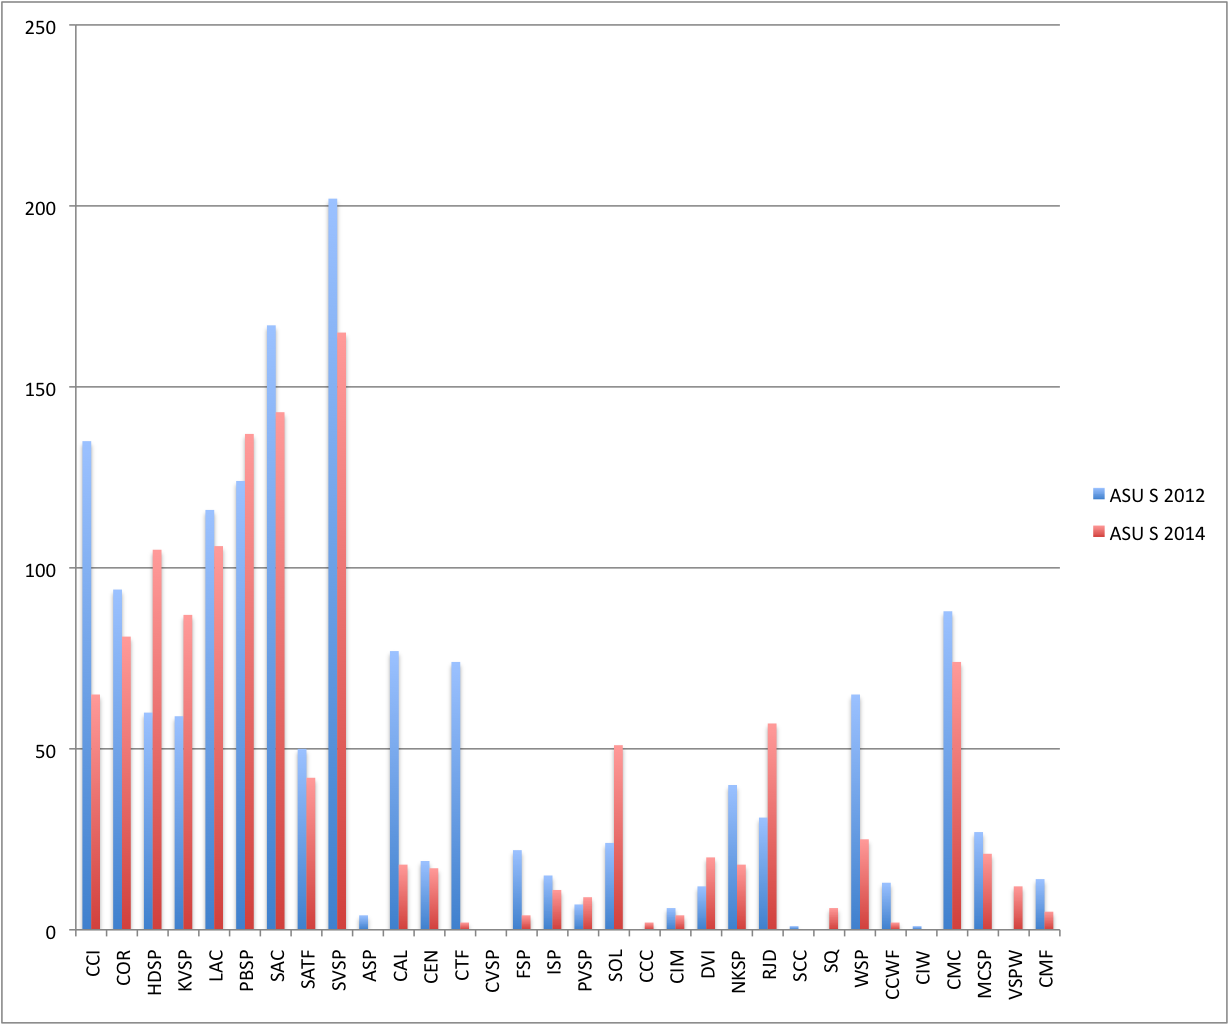
The fluctuations in single-cell status across institutions are as of yet unexplained.
Unlike what is available for the SHU, CDCR makes available through COMPSTAT the average terms in the ASU per institution. ASUs are not designed for long-term housing and do not typically come with any significant form of programming. While in theory individuals shouldn’t spend very much time the ASU, COMPSTAT data consistently shows long-terms in the ASU.

As seen in the above chart, lengths of stay in the ASU vary across prisons and time.
In October 2012, the average term in the ASU was 107.5 days. Two years later, the average ASU term was 89.6 days, a significant decline.
In 2012, among male facilities, Sierra Conservation Center had the lowest average length of stay in the ASU, with an average of 42 days. Calipatria State Prison had the longest, with an average ASU stay of 266 days. In 2014, Chuckawalla Valley had the briefest length of stay of stay in the ASU, with terms of 36 days. Ironwood State Prison had the longest average stay in the ASU, at 132 days.
Conclusions
It appears that the total use of single-cell housing is on the decline. Further, total use of SHU and ASUs in both raw numbers and as a percentage of the prison population have declined. In the SHU, there has been a slight decline in the use of single-cell housing, though a slight increase in the SHU population at Pelican Bay State Prison. In the ASU, the percentage of individuals in the ASU on single-cell status has slightly increased, though there have been significant declines in terms of stay in the ASU.
There are a few potential explanations for the decline in single-cell placement and the use of segregation units. First, the case-by-case SHU and ASU reviews that have been occurring have undoubtedly contributed to the decline of segregation populations. As a result of those reviews, hundreds of individuals have been transferred out of the SHU and ASU and placed in general population. Second, there ought to have been reductions in the total single-cell population in part due to court-ordered reforms pertaining to the segregating of individuals receiving mental health treatment. Thirdly, it is possible that some individuals in segregation units have benefited in recent years from prison population reductions.
Thus far, for advocates of reducing the use of solitary confinement, there is cause for cautious optimism within the data. At the same time, there is much more that can be done.
COMMENTS POLICY
Solitary Watch encourages comments and welcomes a range of ideas, opinions, debates, and respectful disagreement. We do not allow name-calling, bullying, cursing, or personal attacks of any kind. Any embedded links should be to information relevant to the conversation. Comments that violate these guidelines will be removed, and repeat offenders will be blocked. Thank you for your cooperation.
From Sal’s last such report titled:
“How Many People Are In Solitary Confinement in California’s Prisons?”
On December 4, 2013
“In October 2012, there were 7,007 individuals in ASUs
In September 2013, there were 6,734 individuals in ASUs:
Of them, there were 1,685 on single-cell status (25%)
Los Angeles County had the largest ASU population (412)
7,007 – 6,734 = 273 overall reduction.
But it had resulted in an increase in LA County’s population by 50.
412 – 362 = 50
It seems if you squeeze down on one point on this balloon other parts swell.
As this excerpt from a Public Policy Institute titled,
Impact of Realignment on County Jail Populations,
notes:
“The jail population of Los Angeles County has increased almost one-for-one with the number of realigned inmates sent to the county.”
http://www.ppic.org/content/pubs/report/R_613MLR.pdf
Be interested to hear your thoughts on this.